Photographic Collection - BHMPI

Infographics to the Status Report 2022–2024

The following infographics present selected graphical insights into activities, holdings and data of the Photographic Collection.

For more information see https://www.biblhertz.it/en/photographic-collection.

The Photographic Collection's Activity

Documenting Art Historical Works between 2022 and 2024

The map shows the photographic campaigns (red) carried out by the institute's photographer, Enrico Fontolan, and acquisitions of photographs (white) from external professional documentation photographers.

This map attributes one marker to each location referring to a campaign or an acquisition. However, acquisition units may refer to multiple locations and a single location may include more than one photographic campaign. The size of the markers renders approximately the relative size of the acquisition, ranging from a single image to several thousands of digital and/or analog images.

Photographic Campaigns and Acquisitions

The two main channels of systematic growth of the Photographic Collection – photographic campaigns and acquisitions – during the last years are illustrated below.

Other Activities of the Photographic Collection

Tasks and Activities

The following pie chart demonstrates an estimate of the time per month and staff member dedicated to the main tasks and activities of the Photographic Collection (2022–2024).

The Photographic Collection's Extent and Structure

The Digital Photographs

This chart shows the steady progress in cataloging the photographs, the slow growth of the analog holdings and the large impact of the digitization on the digital assets.

The number of analog acquisitions is estimated according to their acquisition history.

All analog and cataloged images are accessible to users in-house, including the digitized versos of the photographs containing labels and annotations.

Numbers of Cataloged Photographs by Section

The Photographic Collection uses a systematic classification based on the content of the photographs. For the most accurate result, users need to access both the physical collection, which is not yet entirely cataloged but fully organized as well as the online catalog containing all the digital photographs, which, however, are no longer printed to be included in the on-site collection. The intersecting information from the catalog and the collection structure was not explorable before a full digitization of the physical collection was carried out in 2023.

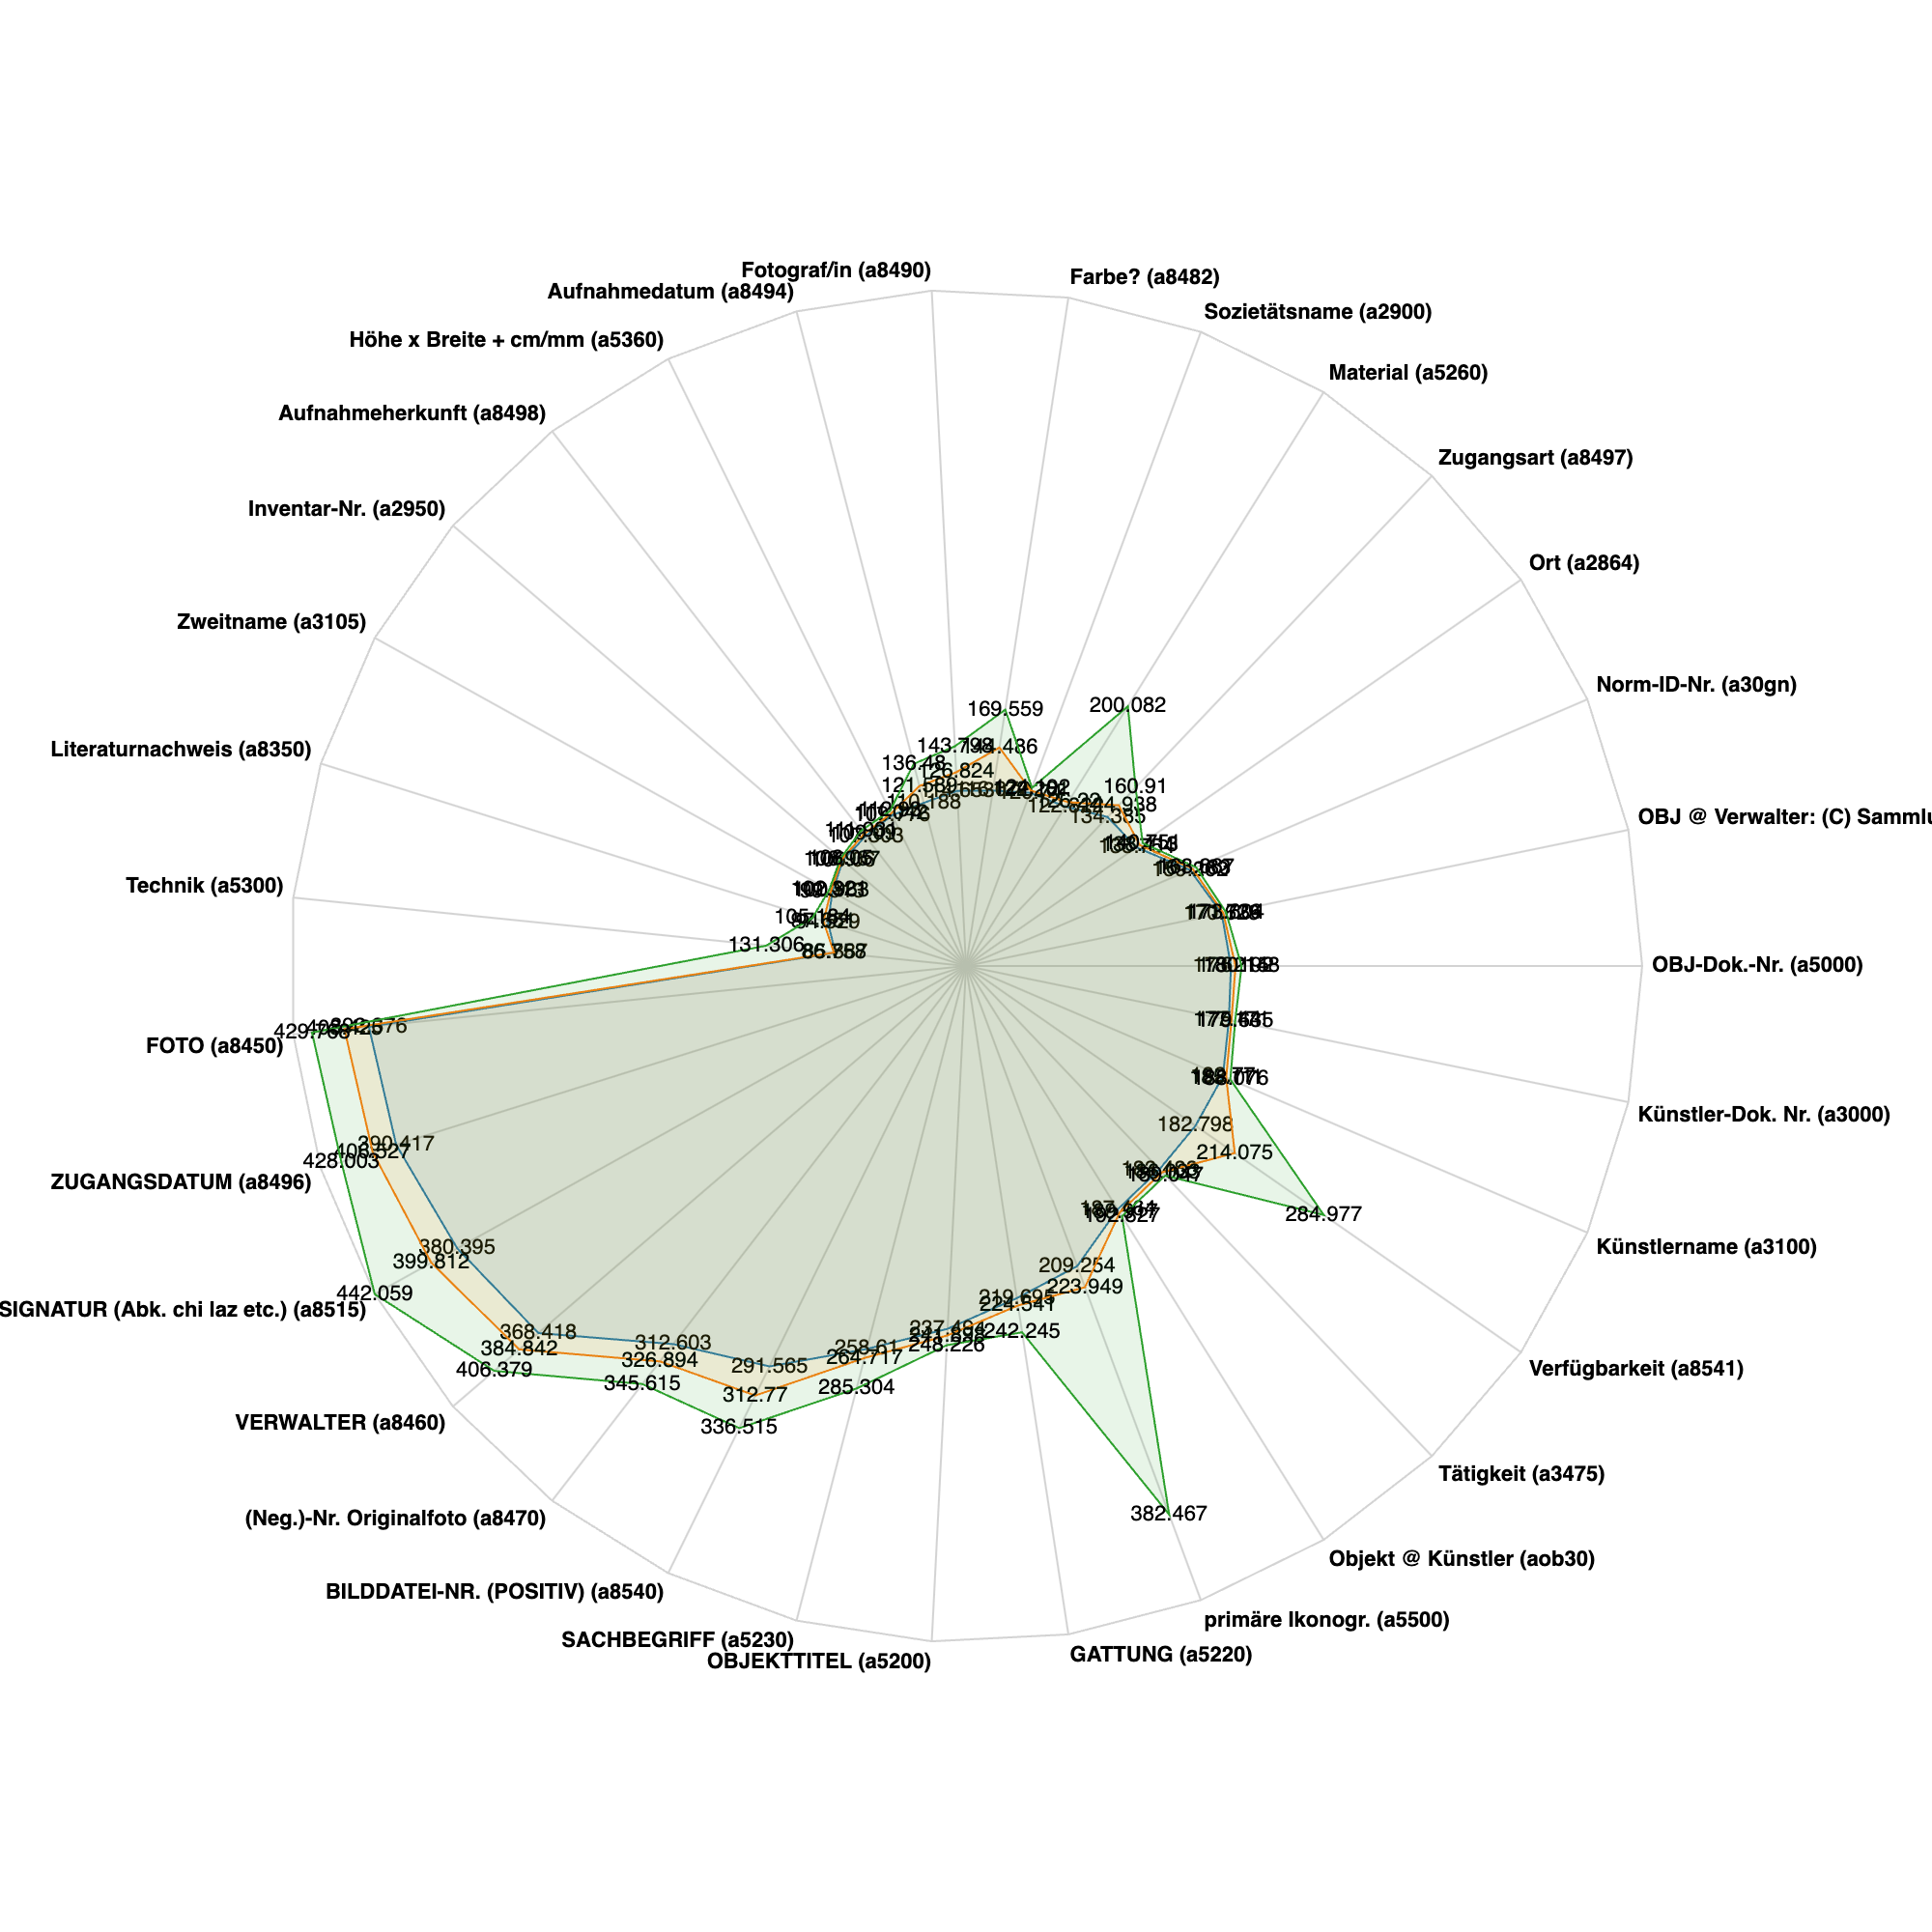
Due to the digitization of the entire collection, it is now possible to extract the exact number of photographs, both analog and digital, for monuments and works of art they depict. Each of the main sections of the Photographic Collection is represented with a bar divided into the different types of assets associated with that section.

The number of the not yet cataloged analog photographs is the result of subtracting the number of cataloged images from the total of the digitized rectos which we now have thanks to the digitization project. Data for the chart has been obtained directly from the available material.

The two sections containing the most photographs are shown separately, not to distort the visualization of the smaller sections.

The Photographic Collection's Catalog Data

Changes in the Data

The Photographic Collection holds 433,592 photographs in the catalog uniquely associated to 180,634 objects and 93,473 object parts related to each other by 63,803 named relations and 42,310 locations or monuments and/or 173,833 collections, and/or 5,534 artists.

The radial chart made with Vega shows the changes and additions in data from 2020 to 2024 for fields represented in the database more than 100,000 times.

The Photographic Collection from the Users Perspective

Photographic Collection Catalog Usage

Matomo Metrics

Metrics also show a steady number of monthly visits to the Photographic Collection’s catalog since its release in February 2023.

Credits

  • Conception: Johannes Röll, Tatjana Bartsch, Pietro Liuzzo.

  • Data and graphics: Pietro Liuzzo.

  • Text: Marina Unger.

  • Open Software used: Google Charts, Vega, Voyant Tools, Observable, eXist-DB.

  • This work is licensed under CC BY-NC-SA 4.0

  • This application is a scientific research product with respect to its contents and the software presenting them.
    No "AI" or "GPT" of any kind and make was used to elaborate contents or scripts, only openly accessible free software.